[삽질 tip] matplotlib.imshow()
matplotlib.imshow()
질문에서 나왔습니다.. 왜 type 을 변경하면 255.0 으로 나누어 주는 작업(normalize) 가 필요한 것일까요?
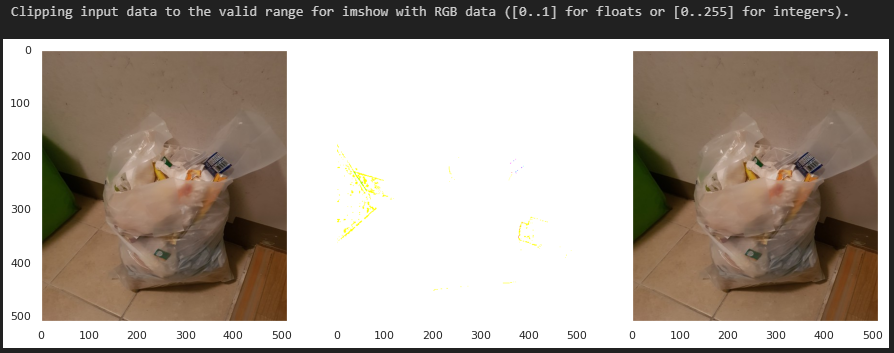
Clipping input data to the valid range for imshow with RGB data ([0..1] for floats or [0..255] for integers).
코드로 직접 구현했을 때, ‘imshow’라는 메소드는 RGB data로 float type일 때, [0, 1] / int type일 때, [0, 255] 라는 조건을 가질 때에만 제대로 된 이미지를 보여지는 것으로 보입니다.
imshow가 matplotlib에서 가져온 것인데,, 보니까 matplotlib의 특징인 것 같습니다.
import sys
coco = COCO("../input/data/train.json")
image_id = coco.getImgIds(imgIds=0)
image_infos = coco.loadImgs(image_id)[0]
dataset_path_1 = '../input/data/'
images = cv2.imread(os.path.join(dataset_path_1, image_infos['file_name']))
plt.imshow(images)
#print(images)

fig, ax = plt.subplots(1, 3, figsize=(15, 5), sharey=True)

images_1 = cv2.cvtColor(images, cv2.COLOR_BGR2RGB).astype(np.int32)
ax[0].imshow(images_1, aspect="auto")

images_2 = cv2.cvtColor(images, cv2.COLOR_BGR2RGB).astype(np.float32)
ax[1].imshow(images_2, aspect="auto")

images_3 = cv2.cvtColor(images, cv2.COLOR_BGR2RGB).astype(np.float32)
images_3 /= 255.0

ax[2].imshow(images_3, aspect="auto")

plt.show()